SoloKat
Location Loss Analytics
Features & Highlights
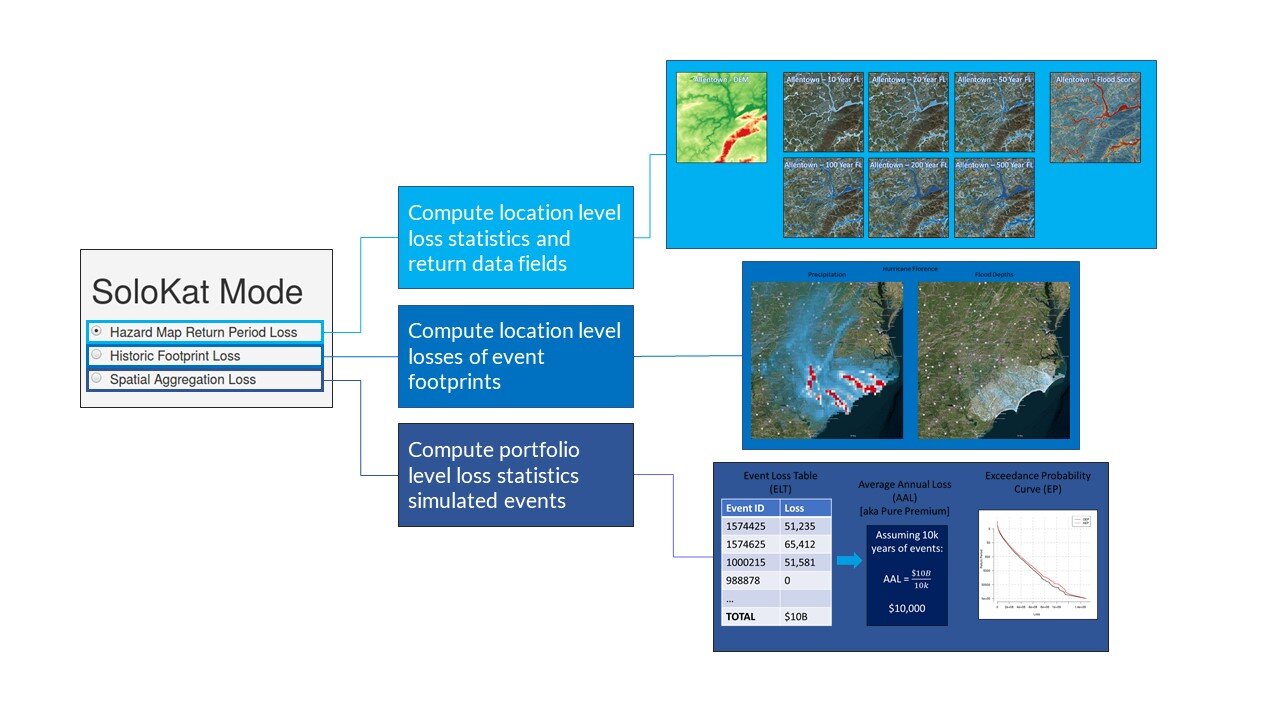
Hazard data is integrated with vulnerability curves to rapidly calculate location-level average annual losses and return period losses including basic location financial terms
Accessible through the KatRisk API
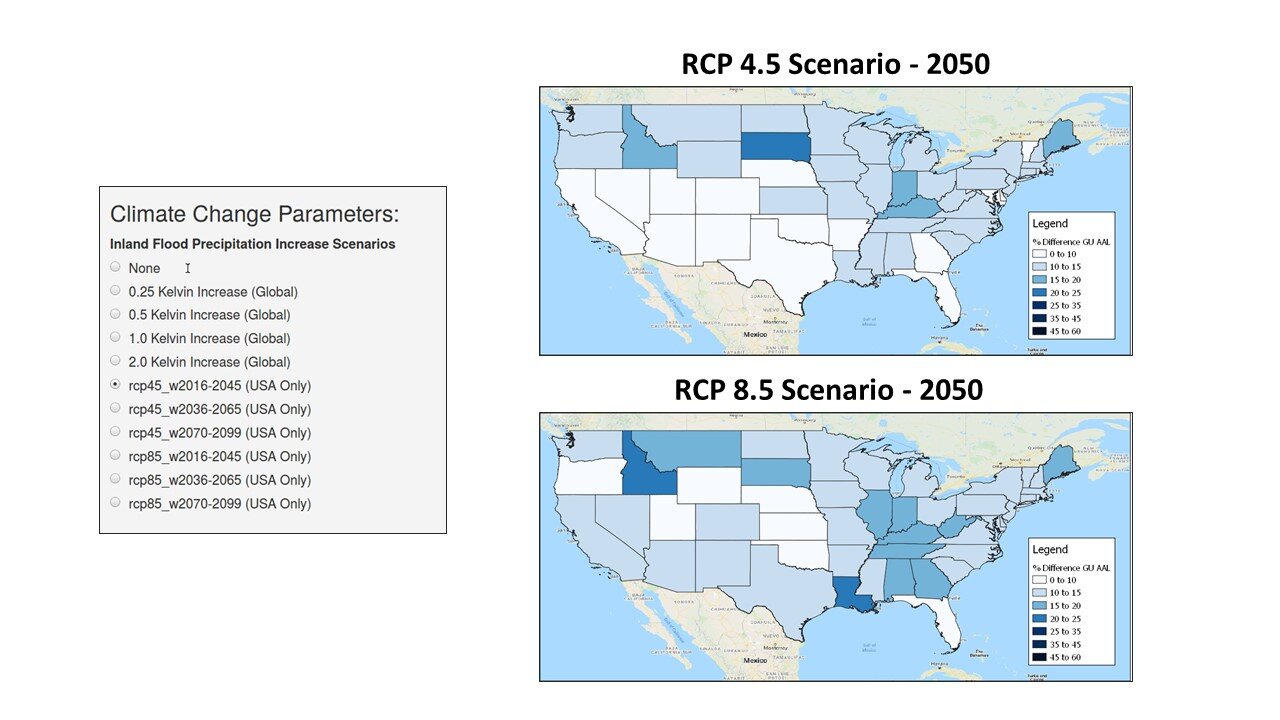
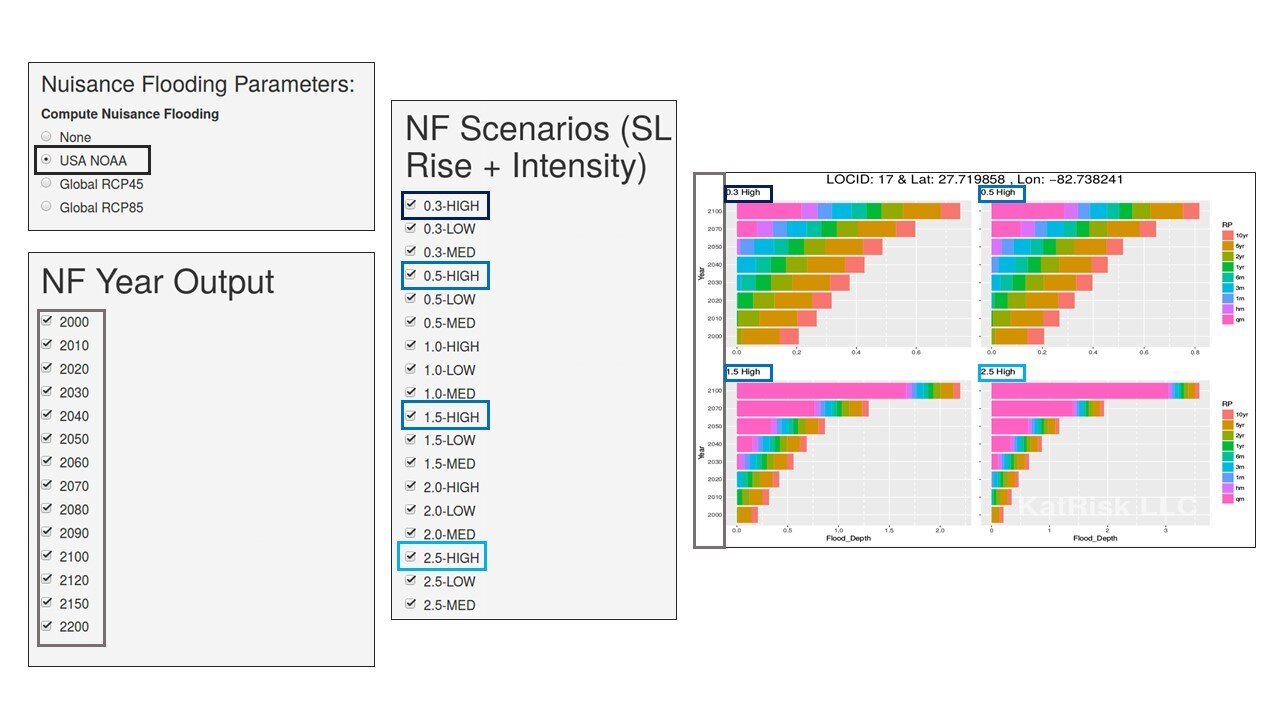
Worldwide inland flood coverage with quantification of potential climate change impacts
Quantification of “sunny day” nuisance flooding
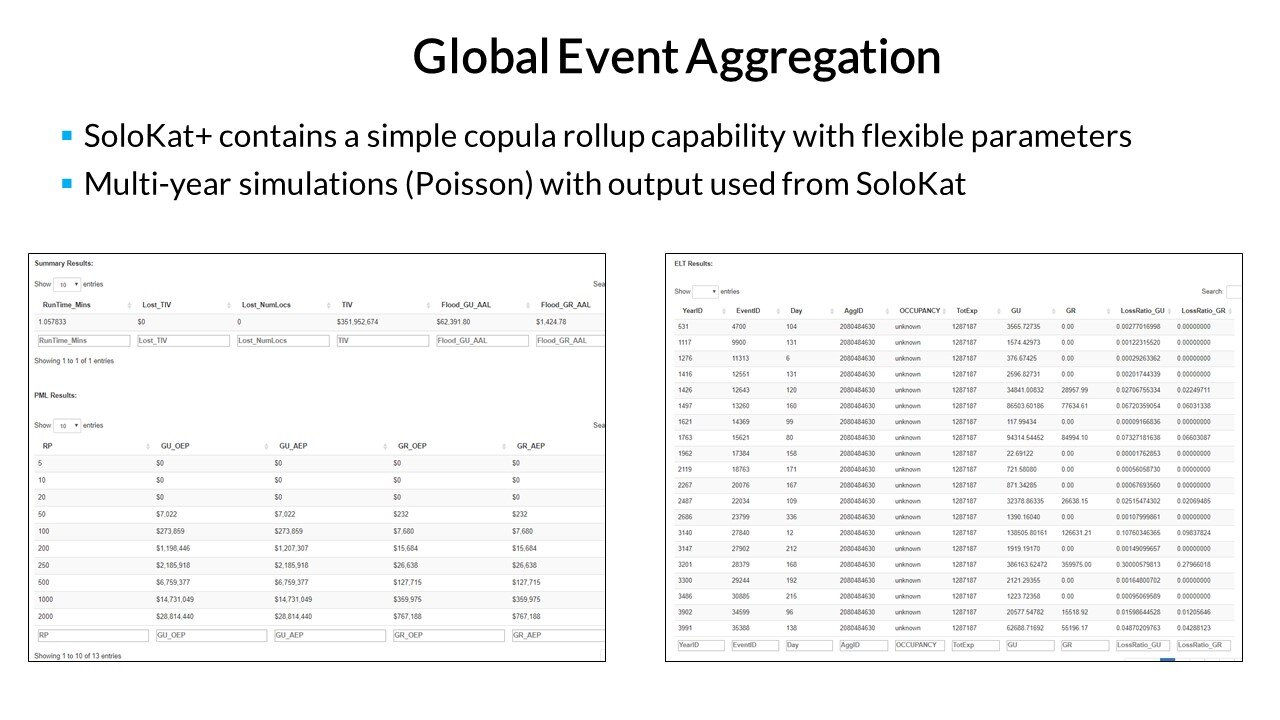
Event simulation allows calculation of aggregate exceedance probability curves worldwide
Compute Inland flood losses for historic or user generated event footprints
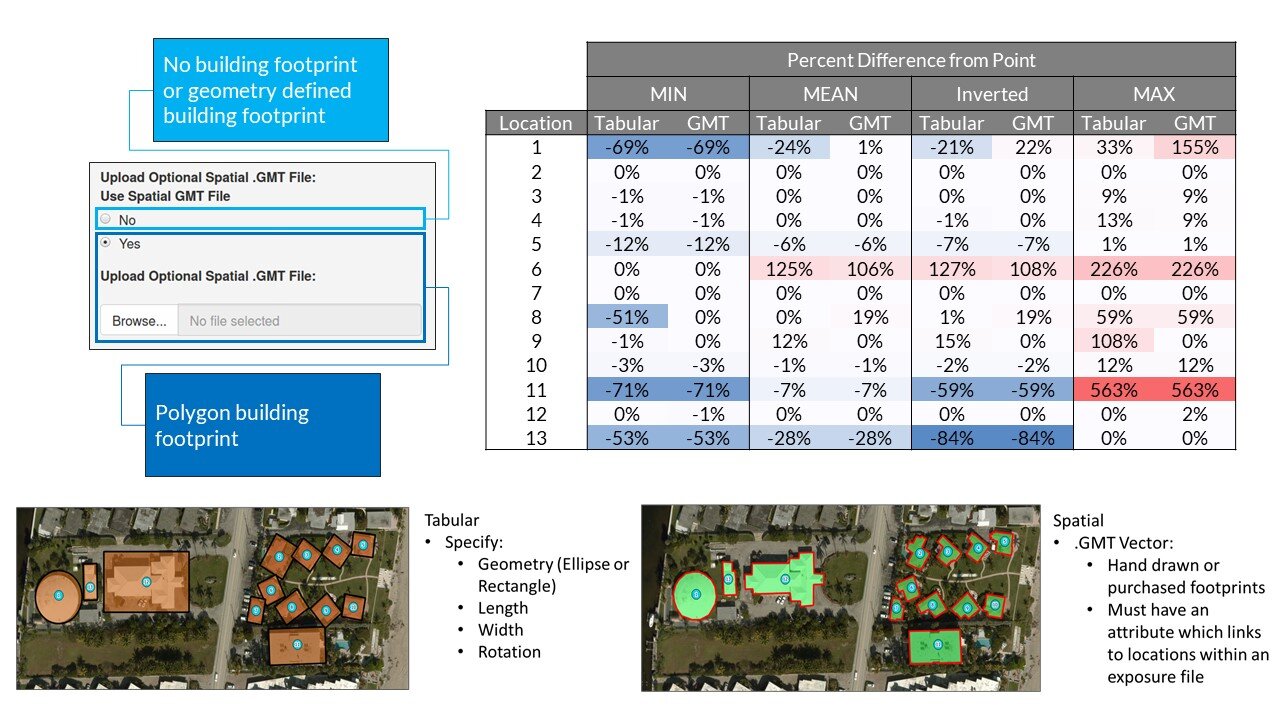
Evaluate a location either as a single point or as a user defined building footprint
Fully modifiable vulnerability curves and associated assumptions
Input
Location latitude/longitude
Coverage values
Construction
Number of stories
Basement
First floor elevation
Deductibles/limits
Default values used where data is unknown
Building footprint
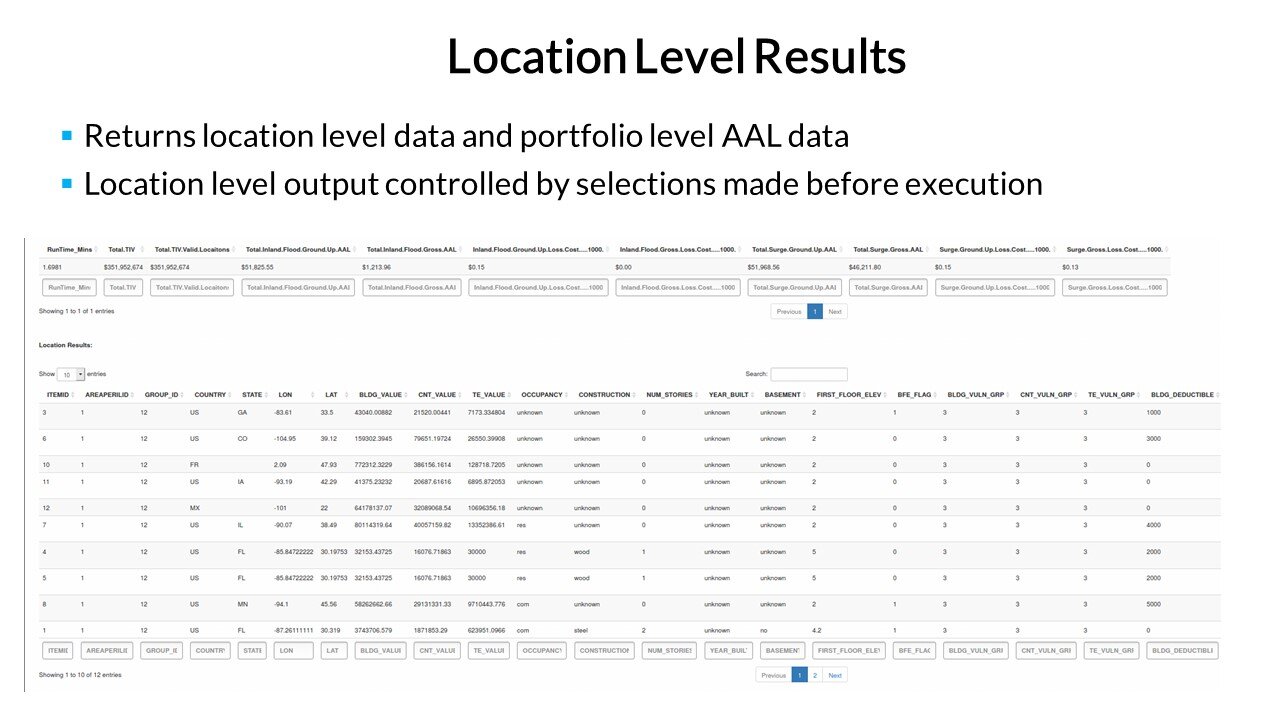
Output
Inland flood depths
Inland flood risk score
Maximum depth within 100 m
Storm surge flood depths
BFE
Local elevation
Average Annual Loss for inland flood and storm surge
Return period losses
Levee information
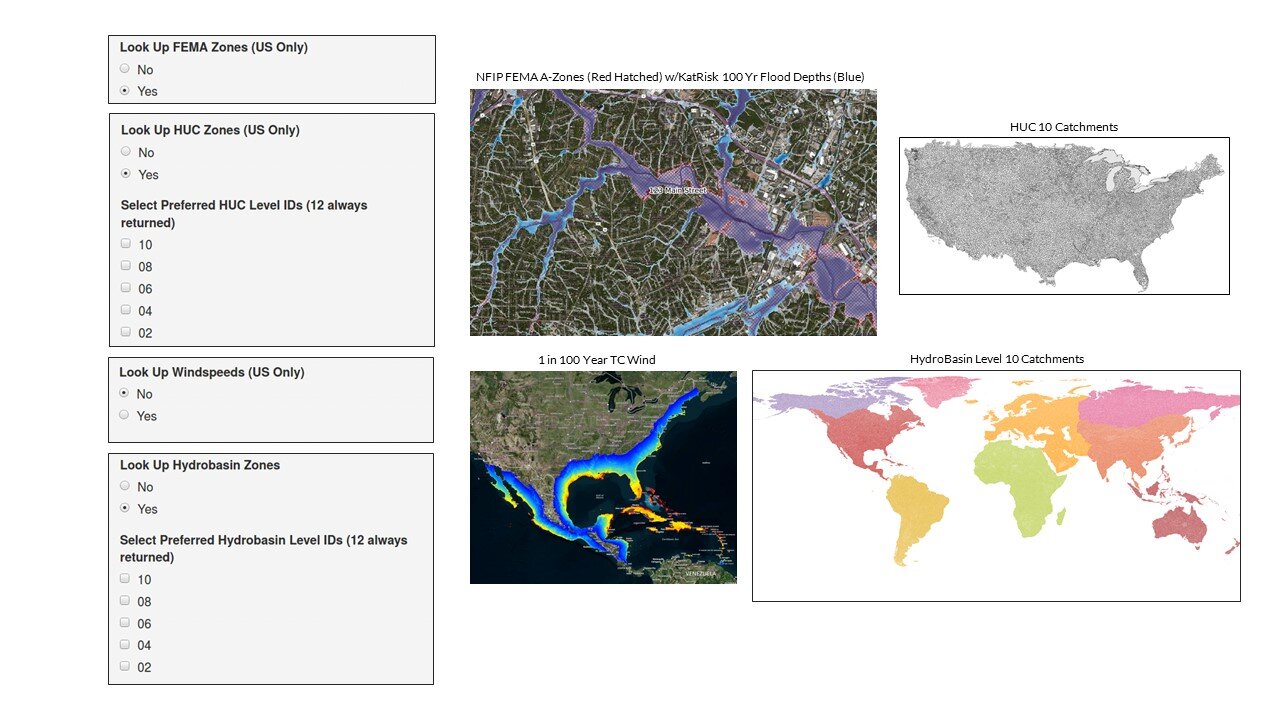
FEMA zone
HUC/HydroBasin zone
Hurricane wind speeds
SoloKat setup demo